No man drifts upward

Stochastic RSI: Key Trading Signals for Market Reversals
Discover how to use the Stochastic RSI for identifying market reversals. Learn to interpret trading signals within a macro context for effective swing entries, long-term positioning, and refining your exit strategies.
Randy Miller
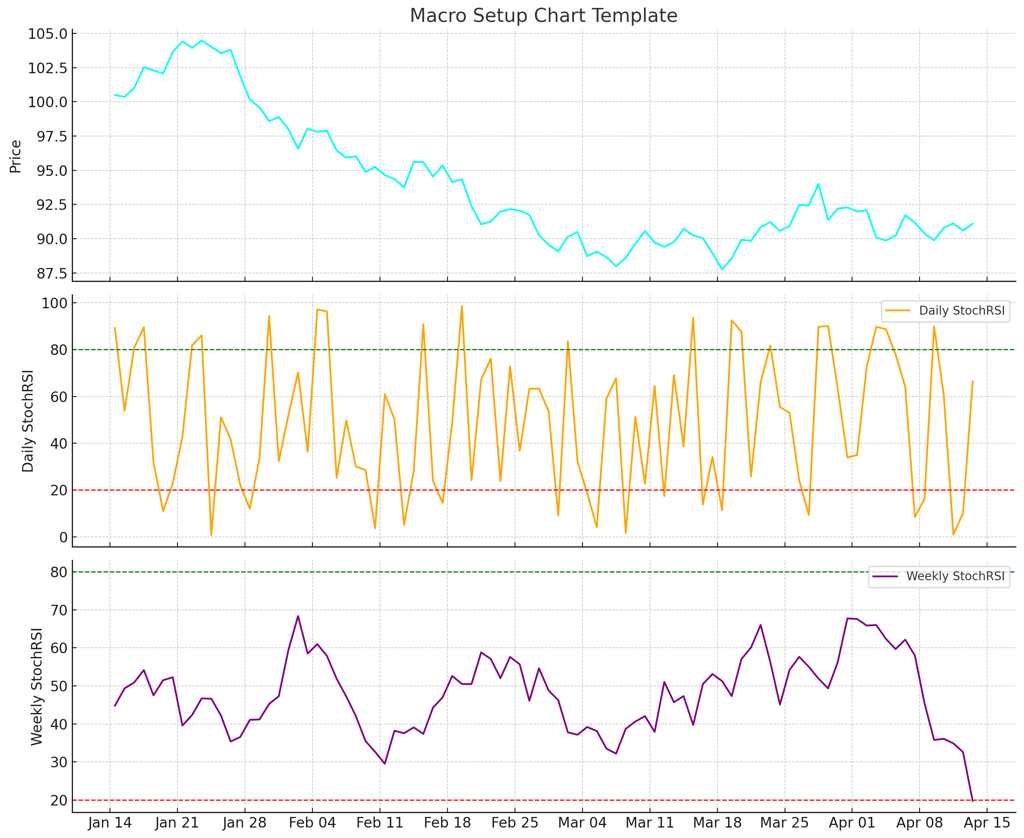
📉 Macro Extremes & the Turning Tide: Reading the StochRSI Signals for Market Reversals
In the realm of trading, precision comes not from prediction, but preparation. A high-value gentleman understands that capital moves in cycles, and his edge lies not in gambling on every fluctuation, but in knowing when the tides are set to shift. One of the most effective tools in identifying those turning points—especially in the crypto and equities markets—is the Stochastic RSI (StochRSI) on the daily and weekly timeframes.
When interpreted with discipline and framed inside a macro context, these signals can act as a strategic compass for swing entries, long-term positioning, and exit strategy refinement. But before we act, we analyze. Let’s break this down.
🔻 Macro Bottom Formation: When the Beast Sleeps
🔧 The Condition:
Daily StochRSI < 20
Weekly StochRSI < 20
This setup indicates multi-timeframe exhaustion. Both the short-term and long-term market momentums are oversold, signaling a scenario where the selling pressure may have run its course.
Think of this as the final gasps of a suffocating bear — not yet dead, but vulnerable.
🧠 What It Means:
Bearish momentum is likely reaching terminal velocity.
Sentiment is desolate. Fear dominates retail psychology.
Smart money—those who trade against emotion—may begin strategic accumulation.
Volatility is expected, but it’s the precursor to directional transformation.
However, this is not an automatic buy. It is the first horn blown before a market reversal battle begins. The real skill lies in knowing how to read the unfolding pattern and respond with composure.
📈 Key Confirmation Signals:
These are the “green lights” to watch for before allocating serious capital:
🔹 Daily StochRSI crosses above 20 → Initial momentum turn.
🔹 Weekly StochRSI begins curling up → Macro trend signal awakens.
🔹 Bullish divergence (Price makes a lower low, but RSI or MACD makes a higher low).
🔹 Price holds major support zones, especially Fibonacci retracements (0.618, 0.786).
These moments represent pivot points — not in hindsight, but in real-time. And for those operating with Assertive Force, this is where the game is won.
🛠 Strategic Application:
For the position trader or long-term swing strategist, this setup is a prime hunting ground. But we don’t enter with arrogance — we deploy with intelligence.
✅ Start small long positions on early reversal signs.
✅ Add size only after weekly momentum confirms — never bet the house on a daily alone.
⚠️ Use tight stops if weekly hasn’t turned — fakeouts are frequent near bottoms.
🧠 Map confluences — zones where support, divergence, volume shifts, and macro conditions align.
To the untrained, this is chaos. To the high-value gentleman, it’s a coded message.
🔺 Macro Top Formation: When Euphoria Peeks
🔧 The Condition:
Daily StochRSI > 80
Weekly StochRSI > 80
This signals a fully extended rally on both timeframes. Prices are bloated. Momentum is maxed. And institutional players are eyeing the exit door while retail continues to chase.
Here lies the deception: upward motion masks internal decay.
🧠 What It Means:
The major uptrend is overextended — not dead, but unstable.
Momentum across both short and long timeframes is peaking, making reversal or slowdown likely.
Market enters the distribution zone — whales and funds begin unloading onto euphoric buyers.
A sharp correction or slow bleed is likely, especially after parabolic runs.
🔻 Reversal Warning Signs:
Watch these signals like a hawk circling prey:
⚠️ Weekly StochRSI curls downward or crosses below 80 — macro shift initiates.
⚠️ Daily fails to make new highs, or forms lower highs — momentum is fading.
⚠️ Volume divergence — price rising but volume shrinking.
⚠️ Topping formations appear: double tops, rising wedges, bearish engulfing candles.
These aren’t guesses. They’re strategic warnings that demand tactical response.
🛠 Strategic Application:
Here’s how the Assertive Force trader tightens his grip while others get greedy:
✅ Tighten stops or trail gains — protect the capital earned during the run.
✅ Take profits partially or fully depending on your holding period.
✅ Aggressive traders may look for early short setups on intraday or 4H charts.
🧠 Never fade the weekly until clear confirmation is present — do not preempt the top with emotion.
It’s not about catching the exact peak — it’s about exiting when the crowd still believes in the lie.
⚖ The Golden Rule: “Weekly Guides the Trend. Daily Times the Entry.”
A man with strategy doesn’t fight the current — he uses the macro trend as his foundation, and the micro movementas his weapon.
🧭 Weekly = Direction
🕰 Daily = Timing
This law applies whether you’re trading Bitcoin, equities, or altcoins. If your strategy doesn’t respect this hierarchy, you’re not trading — you’re gambling.
You never fade the weekly unless you’re scalping — and even then, you must sharpen your blade.
🚀 Final Insight: Assertive Force Deployment
These signals are not “trading tips.” They are force vectors — indicators of when and where to deploy or withdraw capital with intentional precision. The StochRSI framework isn’t about being right, it’s about being ready.
At the Macro Bottom, when everyone else is fleeing — you prepare to enter the storm with vision.
At the Macro Top, when greed blinds the crowd — you prepare to exit with clarity.
This is how legacy capital is built. This is how noble men operate.
Feel the Pull. Assert Force. Escape the Void.
Mindset
Wealth
Legacy
© 2025, All rights reserved upon all original content presented by Randy Miller. Re-use of content within context and link to website is noted within re-use is hereby granted.